
Vis.js is a dynamic, browser based visualisation library. The library is designed to be easy to use, to handle large amounts of dynamic data, and to enable manipulation of and interaction with the data. The library consists of the components DataSet, Timeline, Network, Graph2d and Graph3d.
Timeline Overview
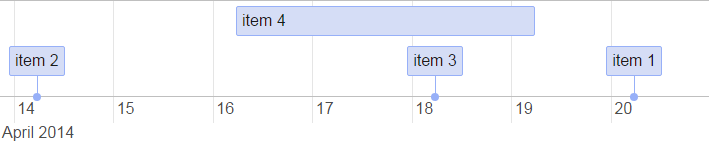
The Timeline is an interactive visualization chart to visualize data in time. Each data is called as an item. The data items can take place on a single date, or have a start and end date (a range).
You can freely move and zoom in the timeline by dragging and scrolling.

Before using the Timeline let’s see some important features
- Dataset object:
We can define Dataset as,
 var items = new vis.DataSet([
{ id: 1, content: 'item 1', start: '2013-04-20' },
{ id: 2, content: 'item 4', start: '2013-04-16', end: '2013-04-19' }
]);
We can combine dates like this,
{ id: 1, content: 'item 1', start: '2013-04-20 12:00:00' }
This DataSet object also supports following options –
 // Adding items:
items.add({ id: 3, content: 'item 3', start: '2013-04-22' });
// Removing items - remove one or many items at a same time
item.remove([1,2,3]);
 // Filtering items
item.get({
fields: ['id'],//we can specify one or more fields
filter: function (item) {
return item.id == 1;
}
});
- Configuration Options:
Options can be used to customize the timeline. Options can zoom In/out, setting max/min zoom level, setting start and end date for display window.Options are defined as a JSON object. All options are optional. Explore more about Options
- Methods:
Method of timeline are very useful when we are going to perform operations. List of some useful methods :Method Description getItemRange() Get the range of all the items getWindow() Get the current visible window redraw() Force a redraw of the Timeline. The size of all items will be recalculated. Can be useful to manually redraw timeline setGroups(groups) A set of groups can be applied to timeline. setItems(items) Set a data set with the items on timeline - Events:
Timeline fires events when changing the visible window by dragging, when selecting items, and when dragging the custom time bar.
Explore more about Events -
Template:
Timeline supports templates to format item contents. We can also manually build the HTML. We can provide a template handler in options. This handler is a function accepting an item’s data as argument and outputs formatted HTML.
 var options = {
template: function (item) {
return item.header + ' : '+ item.description ; } };
In order to support multiple templates, the template handler can be extended to switch between different templates, depending on a specific item property:
 var templates = {
template1: template1,
template2: template2,
template2: template3,
};

var options = {
template: function (item) {
var template = templates[item.template]; // choose the right template
return template(item); // execute the template
}
};
Plot Timeline :
We can plot timeline in two different ways,
- Without Group:
Without group all timelines get plotted in a single row. Individual item gets adjusted depending upon the specified item options in the options json.
If we want we can stop floating of items by adding one line in the options json. i.e stack: false (by default stack is true).See example
- With Group:
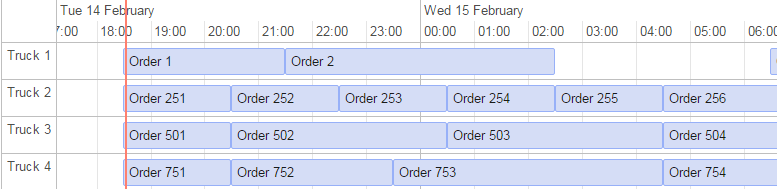
With a group, items with the same group get plotted in the same row. We can also specify group sequence (sorting according to name or id).See example
Add custom lines on the Timeline:
We can add our custom lines on the timeline like current date. This is helpful when we want to display some important date or we can use it like an event date.
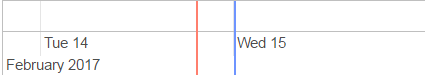
We can add a custom line (in blue color) by using the timeline method, addCustomTime([time]);
Steps to implement Timeline:
- Step 1
Visjs is available at npm and bower, if you have an existing application, then run the following command to download it to your project.Install via npm: npm install vis Install via bower: bower install vis
Or we can use cdn link via cdnjs: http://cdnjs.com
Add below references in the index.html file (used bower version in this example)bower_components/vis/dist/vis.min.css bower_components/vis/dist/vis.min.js
- Step 2
Create a factory for Timeline to create Dataset objectsangular.module('ngVis', []) .factory('VisDataSet', function () { 'use strict'; return function (data, options) { // Create the new dataSets return new vis.DataSet(data, options); }; }) - Step 3
Create Directive for Timeline to bind DataSet, timeline options and events.directive('visTimeline', function () { 'use strict'; return { restrict: 'EA', transclude: false, scope: { data: '=', options: '=', events: '=' }, link: function (scope, element, attr) { var timelineEvents = [ 'rangechange', 'rangechanged', 'timechange', 'timechanged', 'select', 'doubleClick', 'click', 'contextmenu' ]; // Declare the timeline var timeline = null; scope.$watch('data', function () { // Sanity check if (scope.data == null) { return; } // If we've actually changed the data set, then recreate the graph // We can always update the data by adding more data to the existing data set if (timeline != null) { timeline.destroy(); } // Create the timeline object timeline = new vis.Timeline(element[0], scope.data.items, scope.data.groups, scope.options); // Attach an event handler if defined angular.forEach(scope.events, function (callback, event) { if (timelineEvents.indexOf(String(event)) >= 0) { timeline.on(event, callback); } }); // onLoad callback if (scope.events != null && scope.events.onload != null && angular.isFunction(scope.events.onload)) { scope.events.onload(timeline); } }); scope.$watchCollection('options', function (options) { if (timeline == null) { return; } timeline.setOptions(options); }); } }; }); - Step 4
Include directive and factory in your project ( physical file location)
scripts/timeline/timeline.js - Step 5
Include dependency of creating service into parent module.angular.module('visjsTimeline', [ 'ngResource', 'ngRoute', 'ngVis' ]) - Step 6
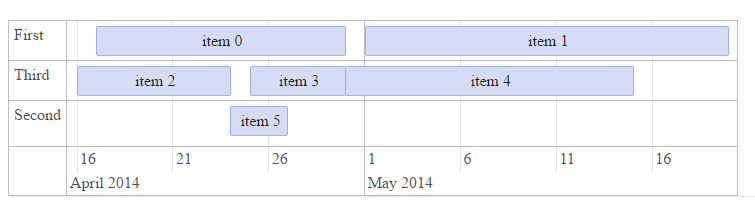
Write options and set group and items dataset of timeline in parent file :$scope.options = { // height:'', //width: '', align: 'center', // left | right (String) autoResize: true, // false (Boolean) editable: true, selectable: true, // start: null, // end: null, margin: { axis: 20, item: 10 }, // min: null, // max: null, // maxHeight: null, orientation: 'bottom',// top or both // type: 'box', // dot | point // zoomMin: 1000, // zoomMax: 1000 * 60 * 60 * 24 * 30 * 12 * 10, // groupOrder: 'content', stack: false }; var groups = VisDataSet([ { id: 0, content: 'First', value: 1 }, { id: 1, content: 'Third', value: 3 }, { id: 2, content: 'Second', value: 2 } ]); var items = VisDataSet([ { id: 0, group: 0, content: 'item 0', start: new Date(2014, 3, 17), end: new Date(2014, 3, 30) }, { id: 1, group: 0, content: 'item 1', start: new Date(2014, 4, 1), end: new Date(2014, 4, 20) }, { id: 2, group: 1, content: 'item 2', start: new Date(2014, 3, 16), end: new Date(2014, 3, 24) }, { id: 3, group: 1, content: 'item 3', start: new Date(2014, 3, 25), end: new Date(2014, 3, 30) }, { id: 4, group: 1, content: 'item 4', start: new Date(2014, 3, 30), end: new Date(2014, 4, 15) }, { id: 5, group: 2, content: 'item 5', start: new Date(2014, 3, 24), end: new Date(2014, 3, 27) } ]); $scope.data = { groups: groups, items: items }; - Step 7
Write below html syntax in parent html page:<vis-timeline data="data" options="options"></vis-timeline>
Screen shot of loaded timeline on the screen:
Download sample code from zCon Solutions Github Repo
Written by Omkar Bodke, Sr. Software Engg. at zCon Solutions
